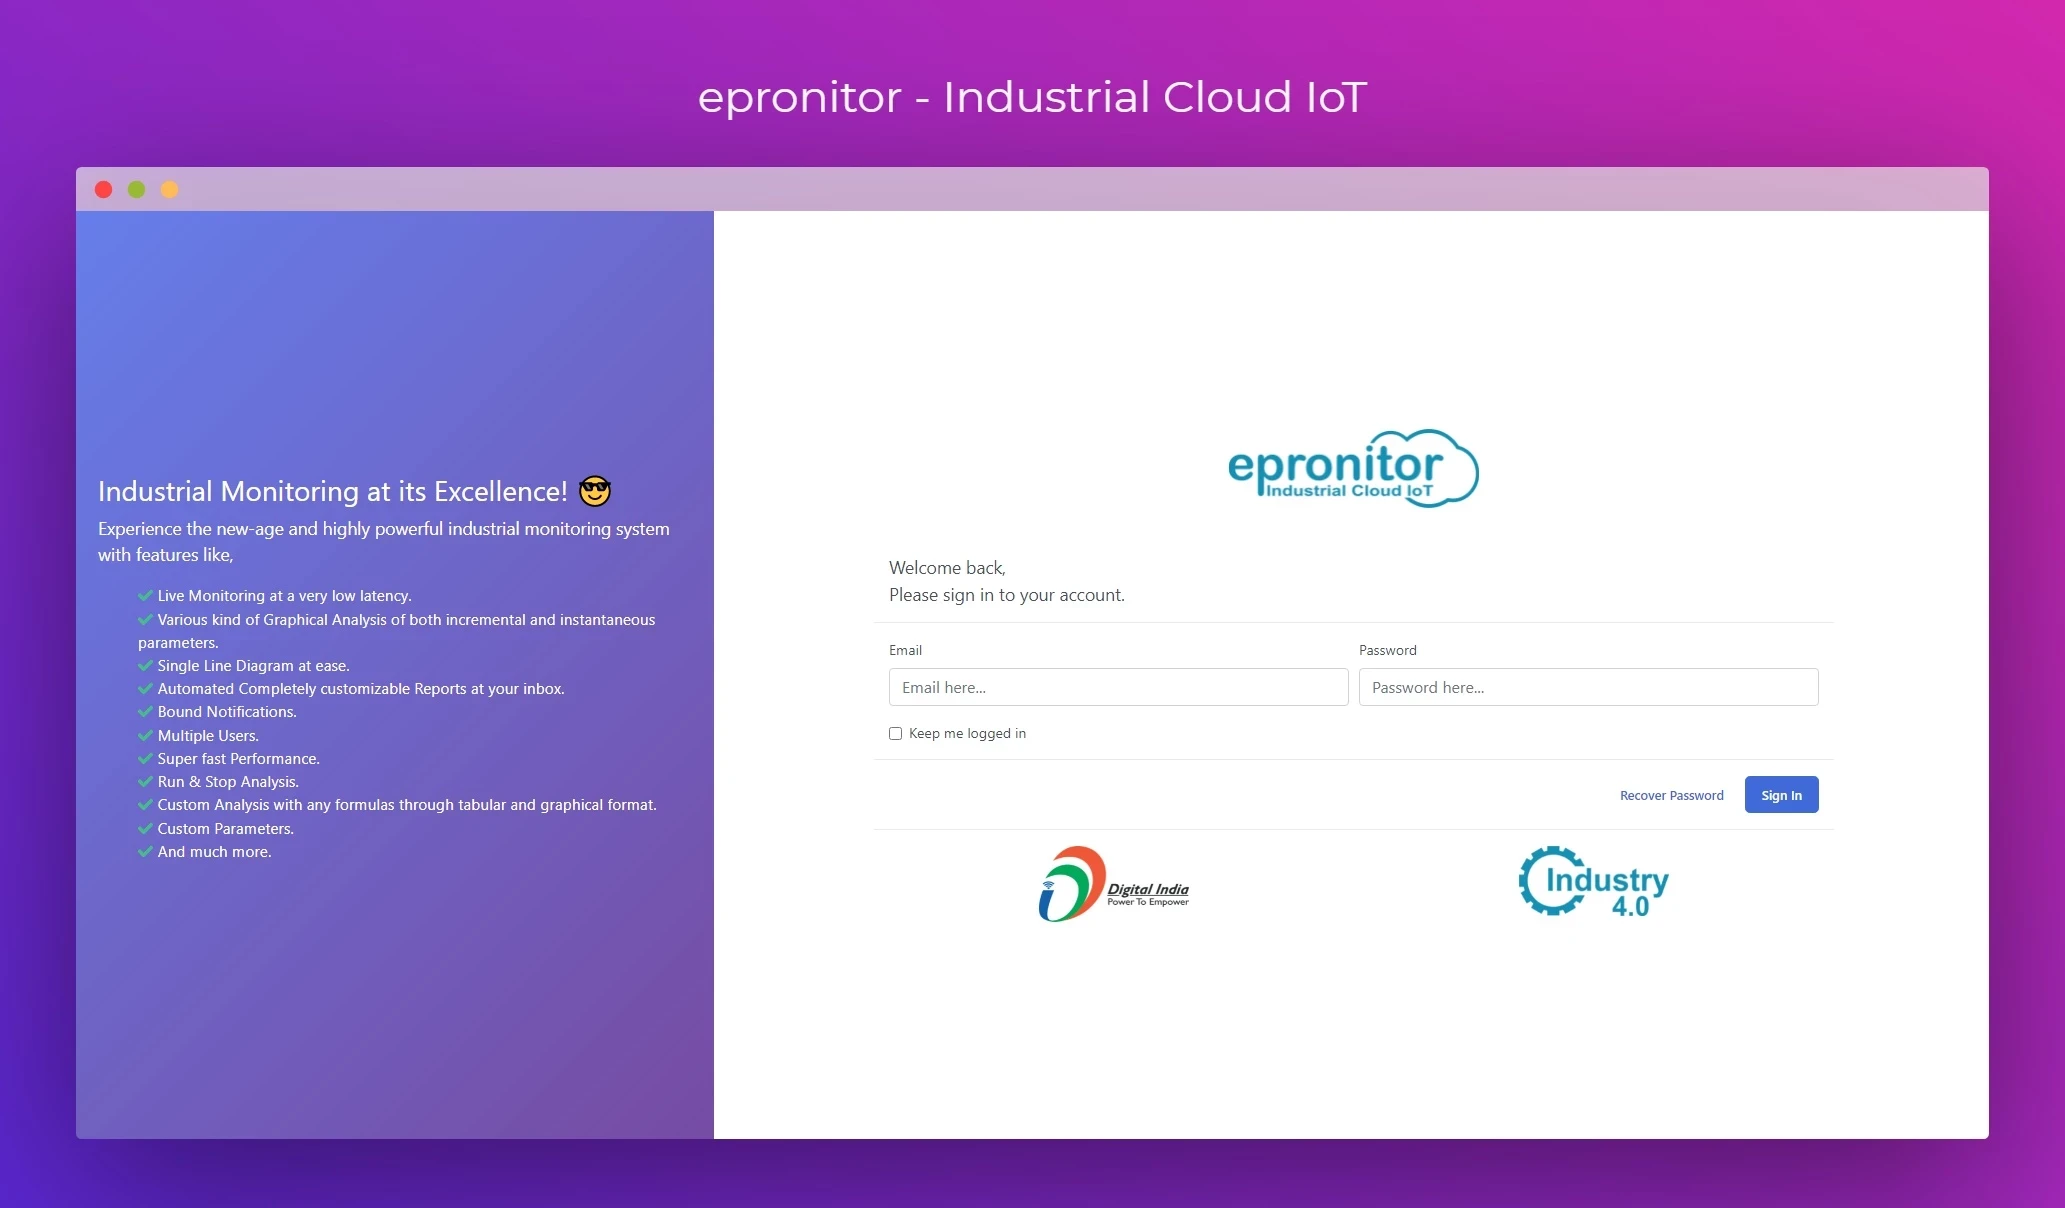
epronitor
epronitor is a new-age strategic monitoring system for different segments, may it be energy, production, temperature, water, anything. It produces analysis in various graphical, tabular, and exportable spreadsheet forms.
About Project
epronitor is a new-age strategic industrial monitoring system for different segments, may it be energy, production, temperature, water, anything. It produces analysis in various graphical, tabular, and exportable spreadsheet forms.
Their Problem
The client requested us for a solution, whereby their end-clients can experience the new-age data analysis of their industrial meters of any kind of segments may it be energy, production, temperature, water, or any other.
In existing architecture, the end clients had to put manpower who manually went to the remote sites (which many time not directly accessible) to check the readings, and then they manually produced various analysis on paper for various reports. This as well has to be solved.
Our Solution
We provided a solution, whereby, we received the data from our hardware connected on-site with the meter and we analyzed the raw data in a graphical and tabular form integrated with automated emails, SMS, and another kind of notifications.
The solution incurred receiving millions of raw data per machine per minute for better accuracy and low latency for being real-time and it then required to be providing various kinds of analysis at the same time for multiple clients.
More about epronitor,
epronitor is where data meets the analysis. It is basically, the Industrial Monitoring System at its Excellence.
epronitor is basically an IoT product with the objective of analytics and data-monitoring in the mind, of which we were responsible for the software part including the APIs for mobile applications in association with Autosoft Solution. The software is built on the Laravel framework and is been used by 100s of clients regularly.
It deals with Industrial meters, may it be of Production or Energy or Temperature (of anything), and makes them analyzable and monitorable online. It provides various features like
✔ Live Monitoring at very low latency,
✔ RealTime Single Line Diagrams at ease,
✔ Bar charts,
✔ Line Charts,
✔ Donut Charts,
✔ Customizable Efficiency Analysis,
✔ Run/Stop Analysis,
✔ Automatic daily completely user-customizable reports,
✔ Bound Notifications
✔ Multiple Users
✔ Custom Parameters
✔ Active Sessions
✔ and much more.


